Analytics
For “A Journey of Music” there are a lot of ways to measure player behaviour, game hardness and game popularity. That’s, why we compiled a list of possible metrics we would like to use, to analyse our game.
# Category 1: Game Popularity
- Retention rate: This metric will help you understand how many players return to the game after playing it once. It is essential to analyse this metric since it is an indicator of whether the game is engaging enough to keep players coming back.
- Time spent in-game: This metric will help you understand how long players are spending in your game. It is an excellent indicator of the game’s addictiveness and engagement level. The more time players spend in the game, the better.
- Average session length: This metric will help you understand how long players are playing the game in one sitting. It is essential to analyse this metric since it can indicate how engaging and addictive the game is.
- Social sharing: This metric will help you understand how many players are sharing your game on social media platforms. It is an splendid indicator of how engaging and addictive the game is, and whether players are motivated to share it with their friends.
- Song popularity: This metric measures which songs/maps are more popular among players. It can help you understand which songs are more engaging and appealing to your audience, and whether there are any patterns or trends to their preferences.
# How to present
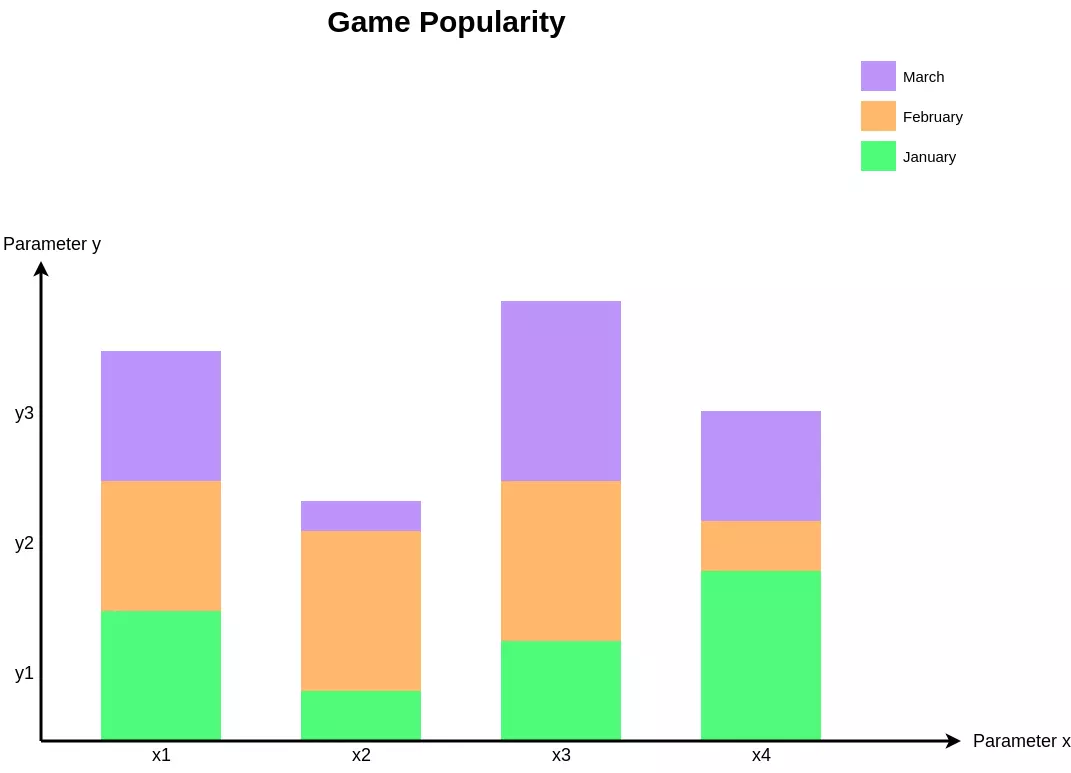
- A Bar Diagram of different colours to compare how the different metrics are at one moment
- A Graph in different colours for every metric to show how game popularity behaves over time
# Category 2: Game Hardness
- Completion rate: This metric will help you understand how many players complete the game. It is essential to analyse this metric since it is an indicator of how well the game is designed and balanced.
- Number of levels played: This metric will help you understand how many levels players are completing. It is an magnificent indicator of how engaging your game is, and whether players are motivated to progress through the different levels.
- Song completion rate: This metric measures how many players are completing each song/map. It can help you understand which maps are more popular and engaging for players and where players might be struggling.
- Death rate: This metric measures how often players are dying in the game. It can help you understand whether the game is too difficult or too easy, and whether players are enjoying the game’s difficulty level.
- Rage quit rate: This metric will monitor if a player quits the game whilst in a level. If he has repeated the level for many times before and then rage quits and other players do the same, the level may be to hard.
# How to present
Some of those metrics have to be seen per level:
- Rage quit/Death Rate has to be represented per level in a different colour
- Completion rate can be seen per level or for the whole game Others have to be represented in a line-diagram, or as the arithmetic average for Number of levels played in comparison to all levels
# Category 3: Player Skill Rating
- Beat accuracy: This metric measures how accurately players are jumping to the rhythm of the beat. It can help you understand how well players are engaging with the music aspect of the game and whether they are finding it challenging or not.
- Song completion rate: This metric measures how many players are completing each song/map. It can help you understand which maps are more popular and engaging for players and where players might be struggling.
- Score/points earned: This metric measures the number of points/score earned by players in each level. It can help you understand which levels are more challenging for players and where they might need more help.
# How to present
Here, a plot graph for different metrics could be made per player, and when in comparison with othe players, there could be another line graph showing the different metrics at specific levels of skill.